eyeZ
eyeZ is a business intelligence profile-matching system. It gathers public data from social networks and the web, matches it into profiles, and shows analysts the people, links and trends behind every case.
Behind every investigation is a question about people: who they are, who they talk to, and what they talk about. eyeZ was designed to answer those questions in one place.
Starting point. Interviews with analysts showed a repeating loop: search, copy, paste, compare, repeat. The new product brings search, matching and analysis into one workspace, organized around three objects analysts already think in: profiles, cases and trends.
Search & trends
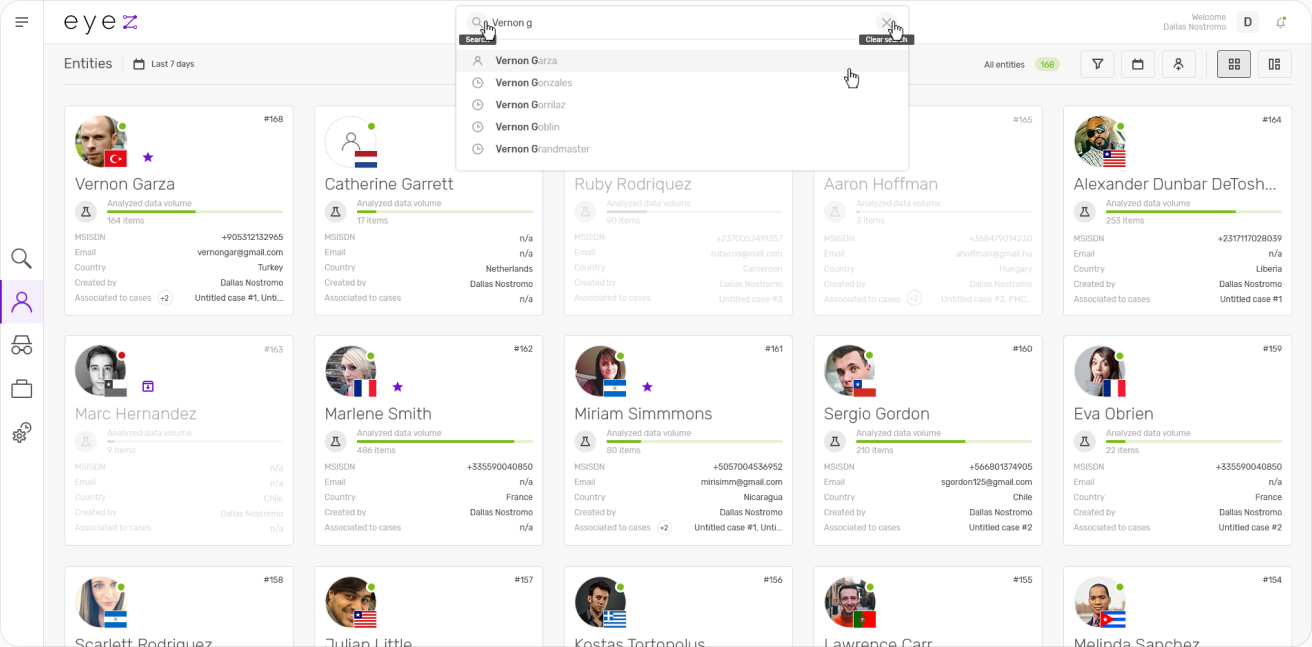
Everything in eyeZ starts with a search. Whatever the analyst types (a person, a username, a topic), the product suggests the right match before they finish typing.
Profile search. Search by name, account or phone number, with autocomplete that shows matching profiles, their photo and source network as you type. Results open in a grid of profile cards.
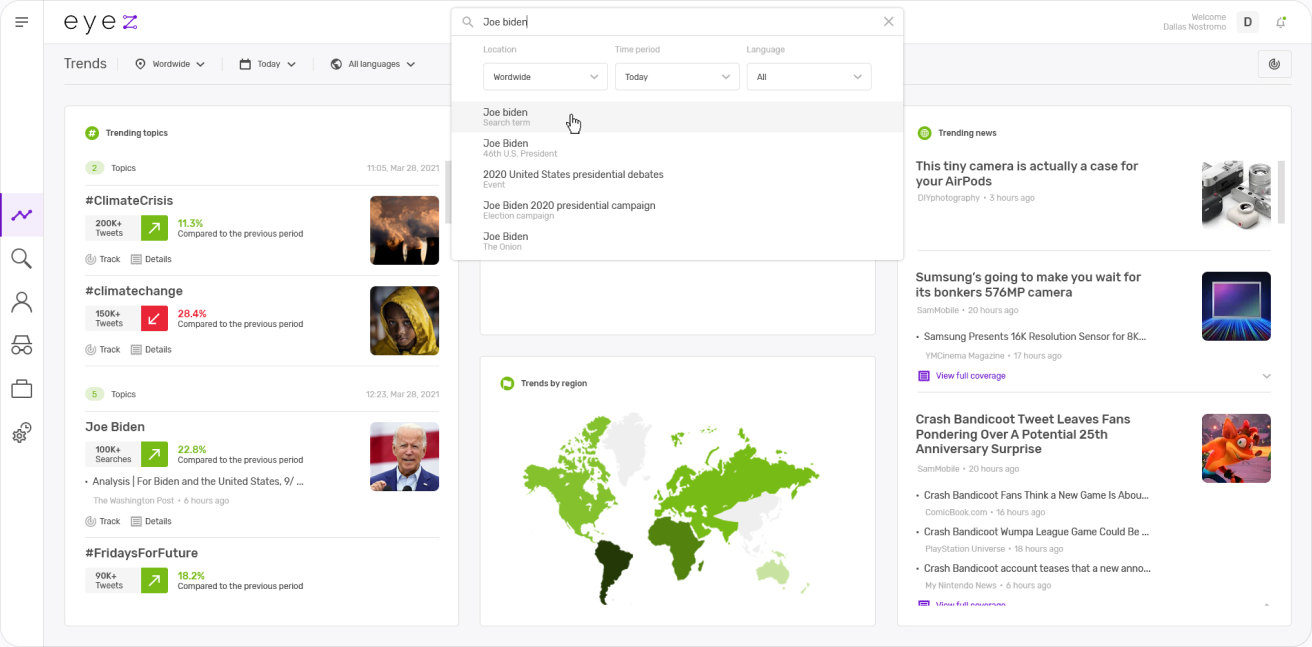
Trends. Trending topics, people and news in one view, filtered by location, time period and language. Each topic shows its volume and change from the previous period, with a map of where it is trending.
Dashboard
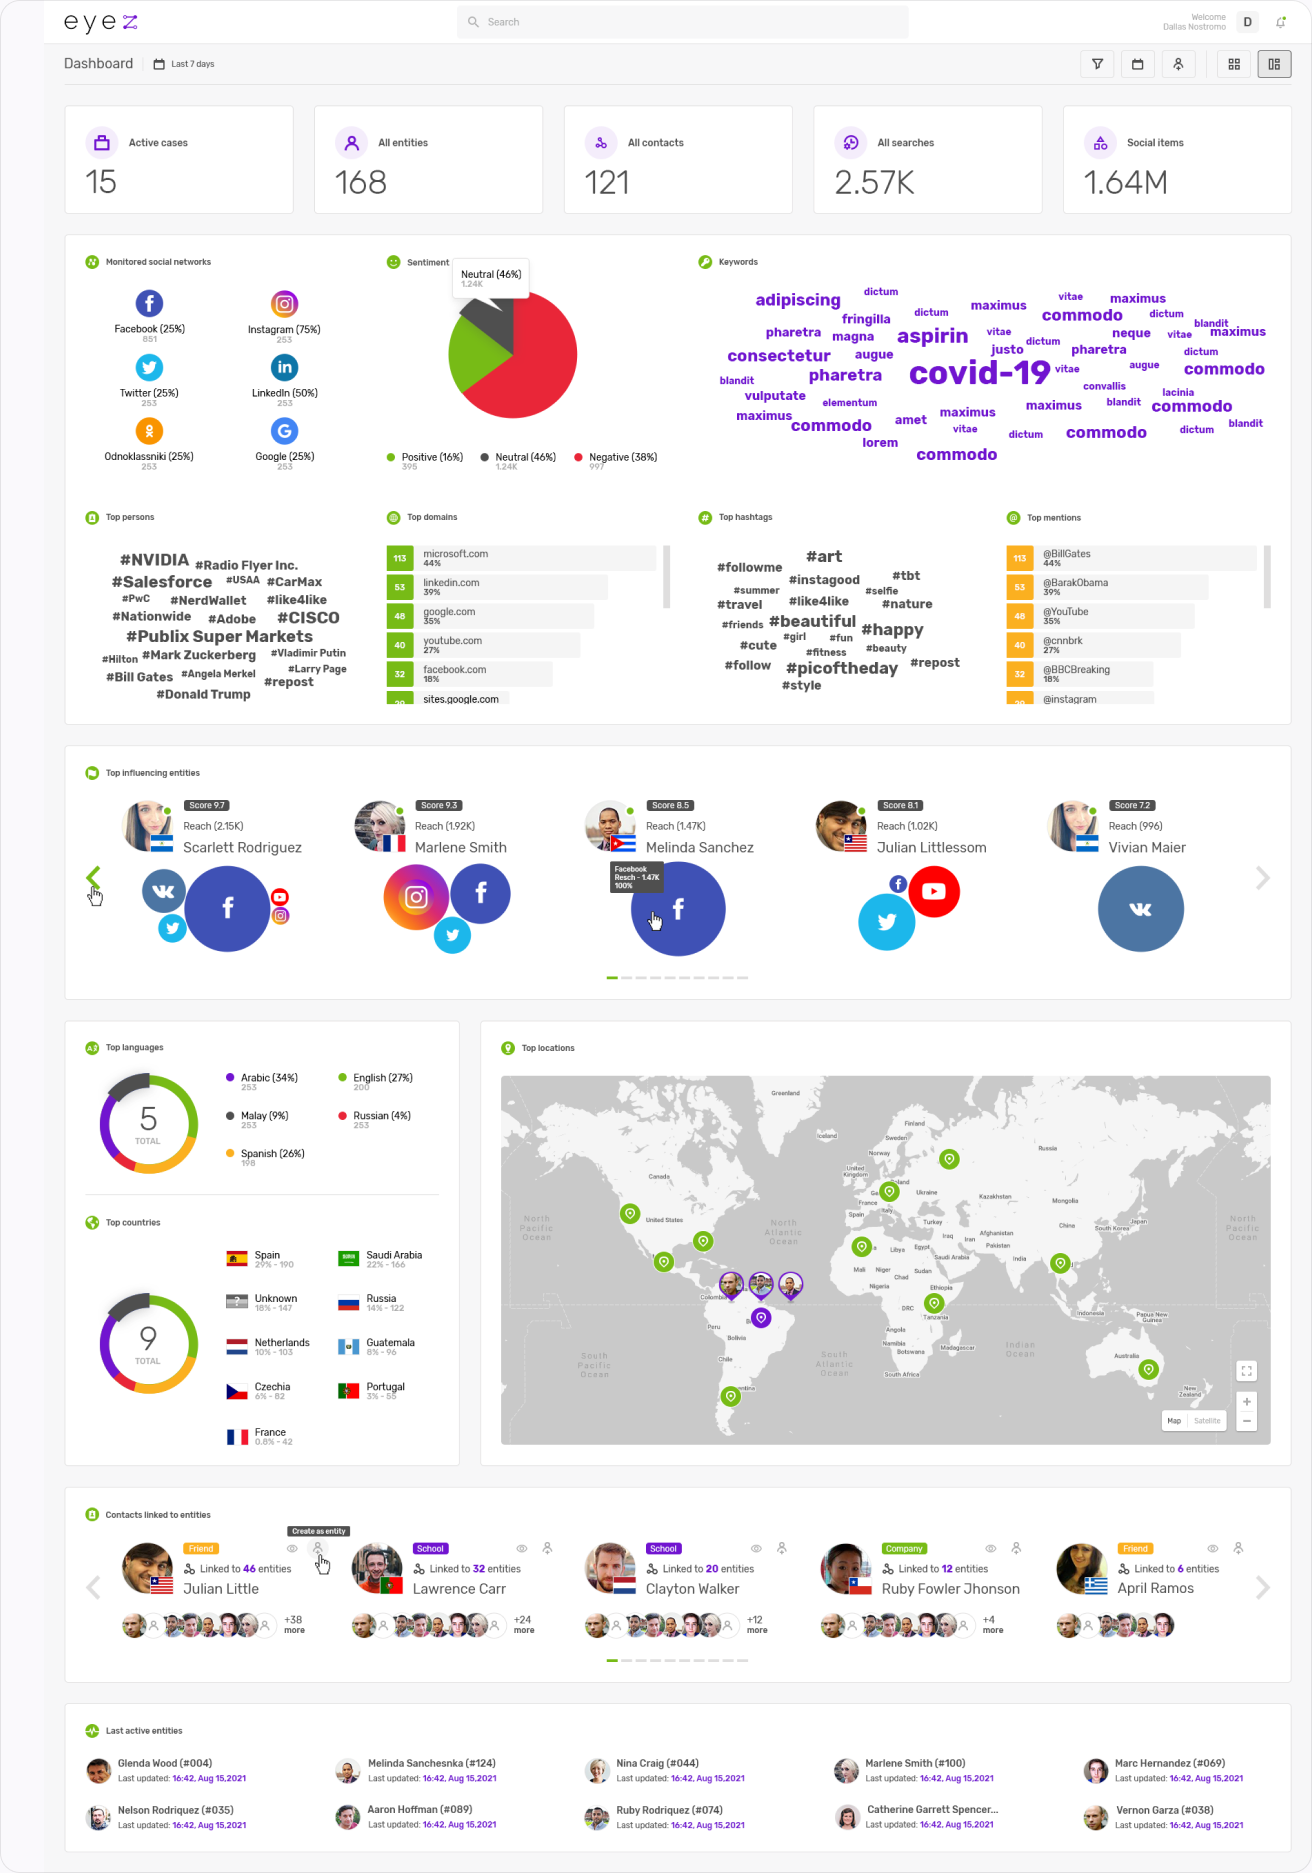
The dashboard answers “what changed?” at a glance, then lets the analyst dig into any number with one click.
Dashboard view. Five headline figures (active cases, entities, contacts, searches and social items), then monitored networks, sentiment, keywords, top people, domains and hashtags. Below: the most influential entities, languages, countries, a map of top locations and the latest contacts linked to entities.
Cases
A case collects everything about one investigation. Tabs keep the overview, entities, links, locations and management separate, while the data stays connected underneath.
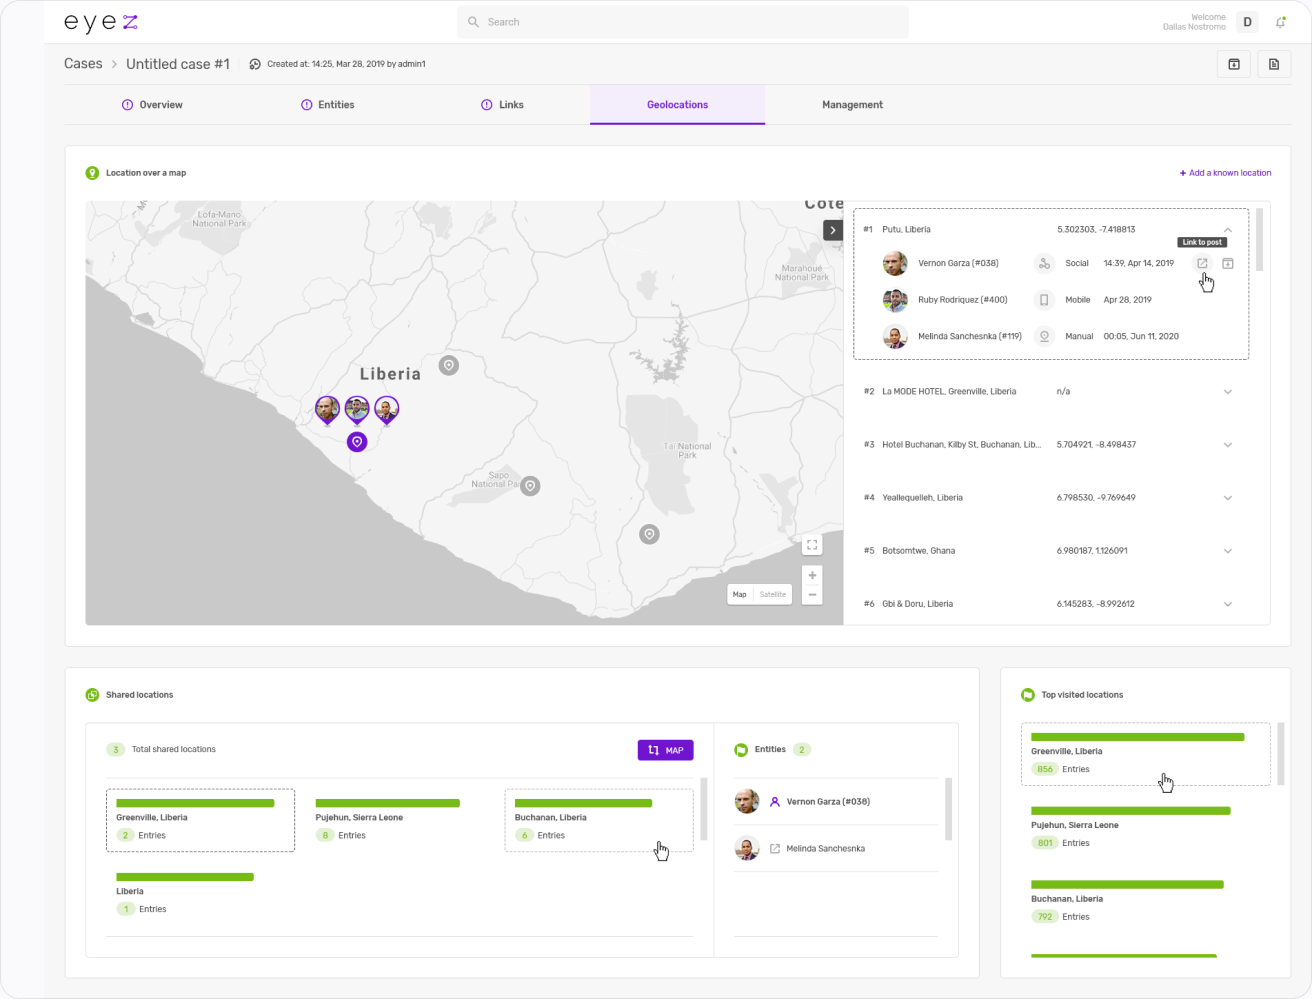
Geolocations. Every location linked to the case on one map: check-ins, tagged posts and known addresses, with filters by entity and time so movement patterns become visible.
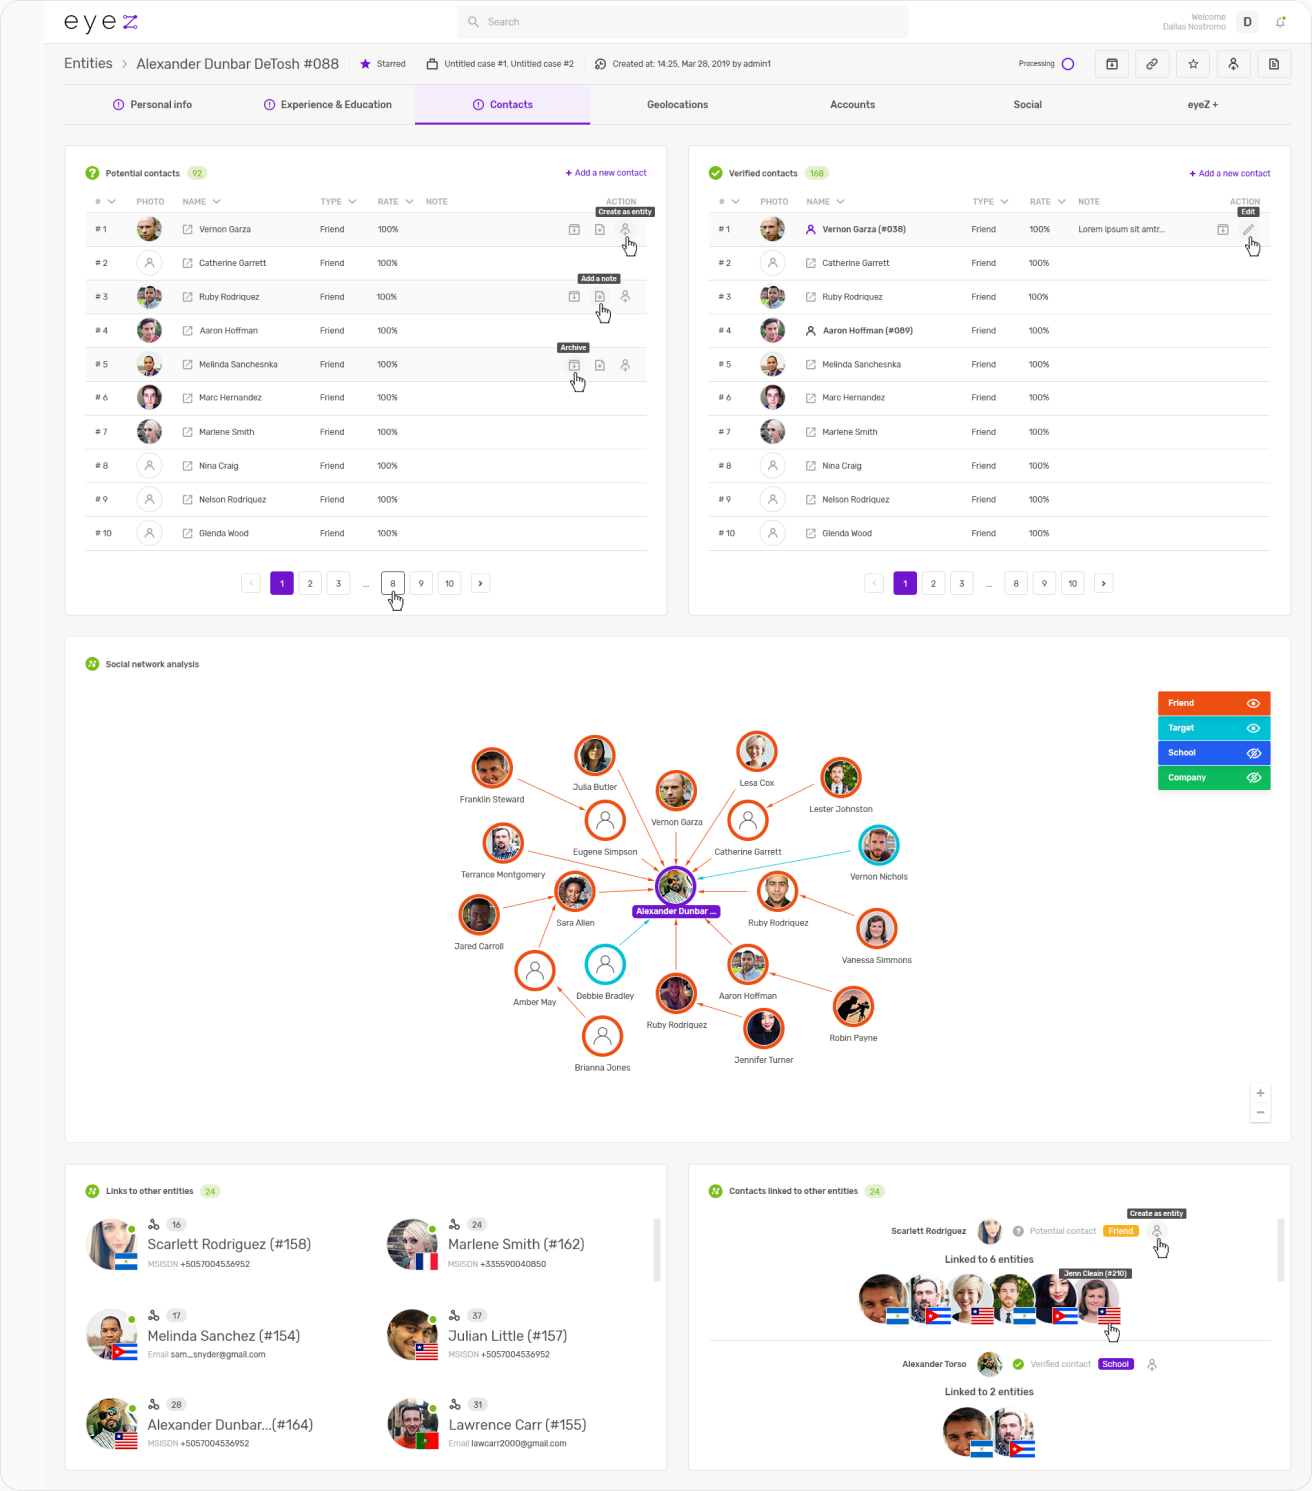
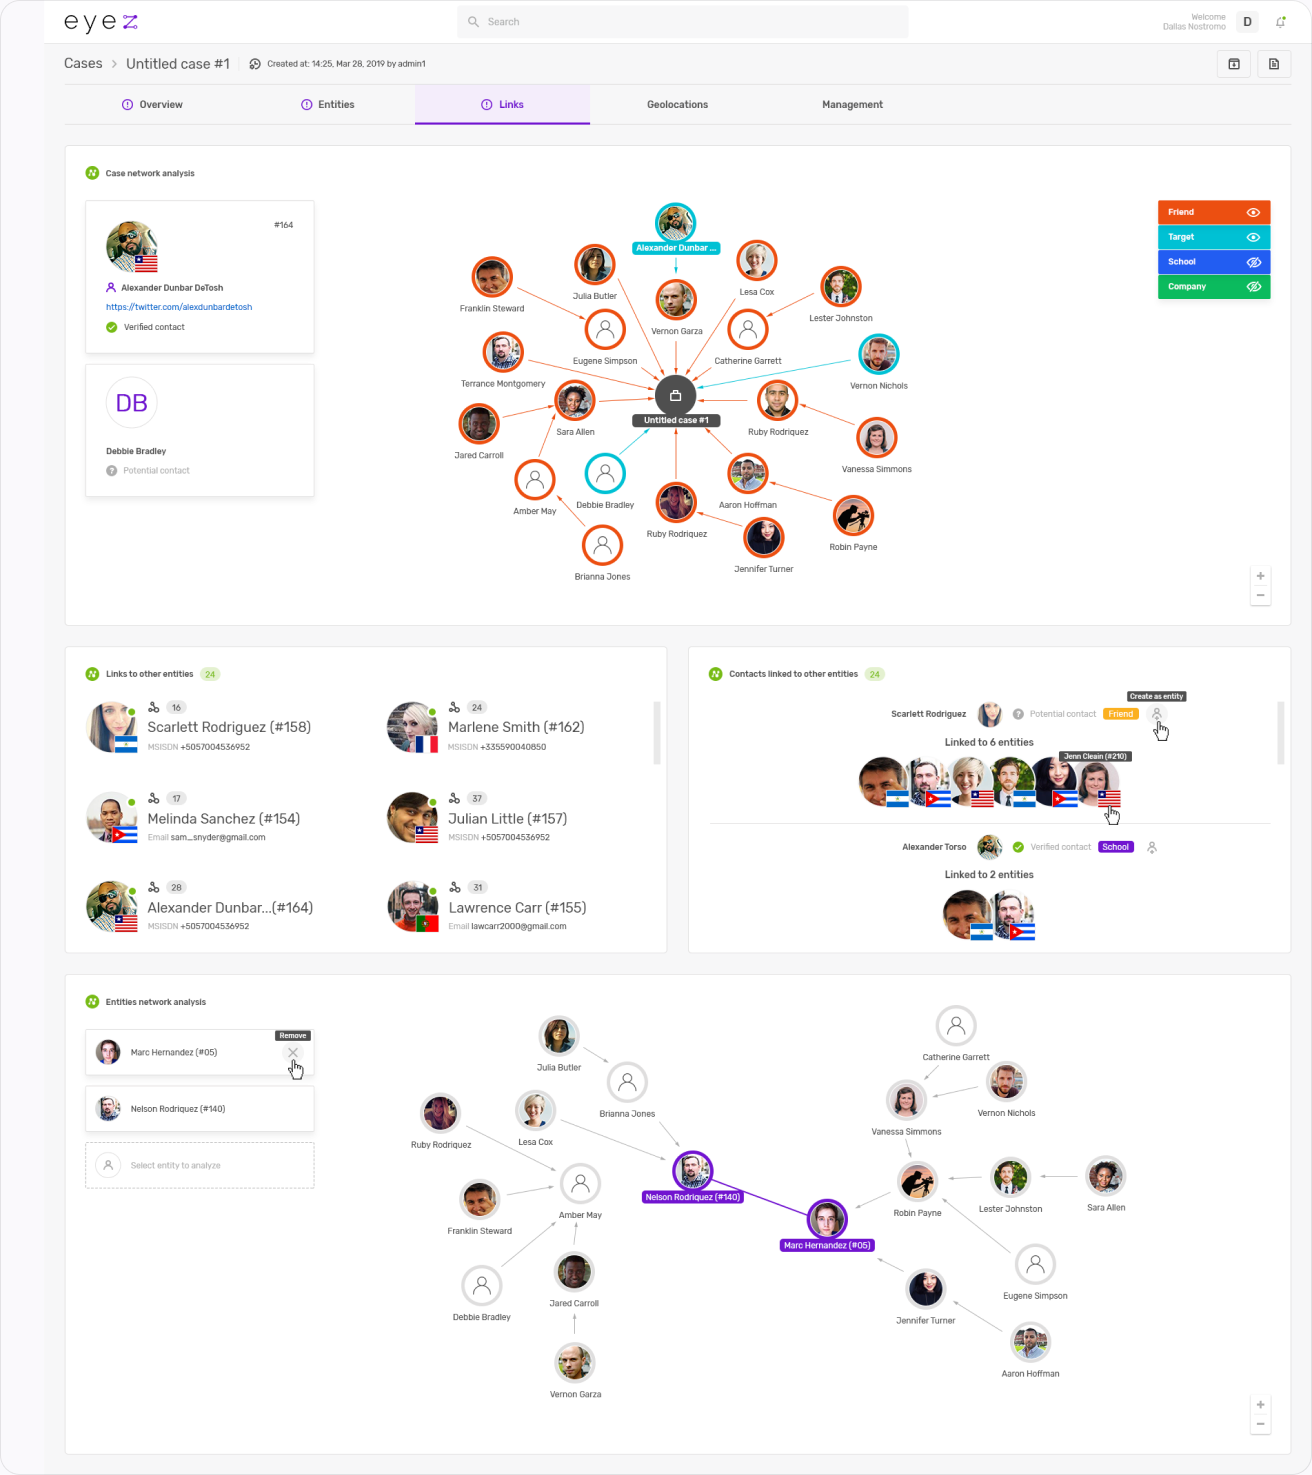
Links. A network graph of the case: who is connected to whom, color-coded by relationship (friend, target, school, company). Below it, linked entities and contacts, and a second graph that finds the shortest path between any two people.
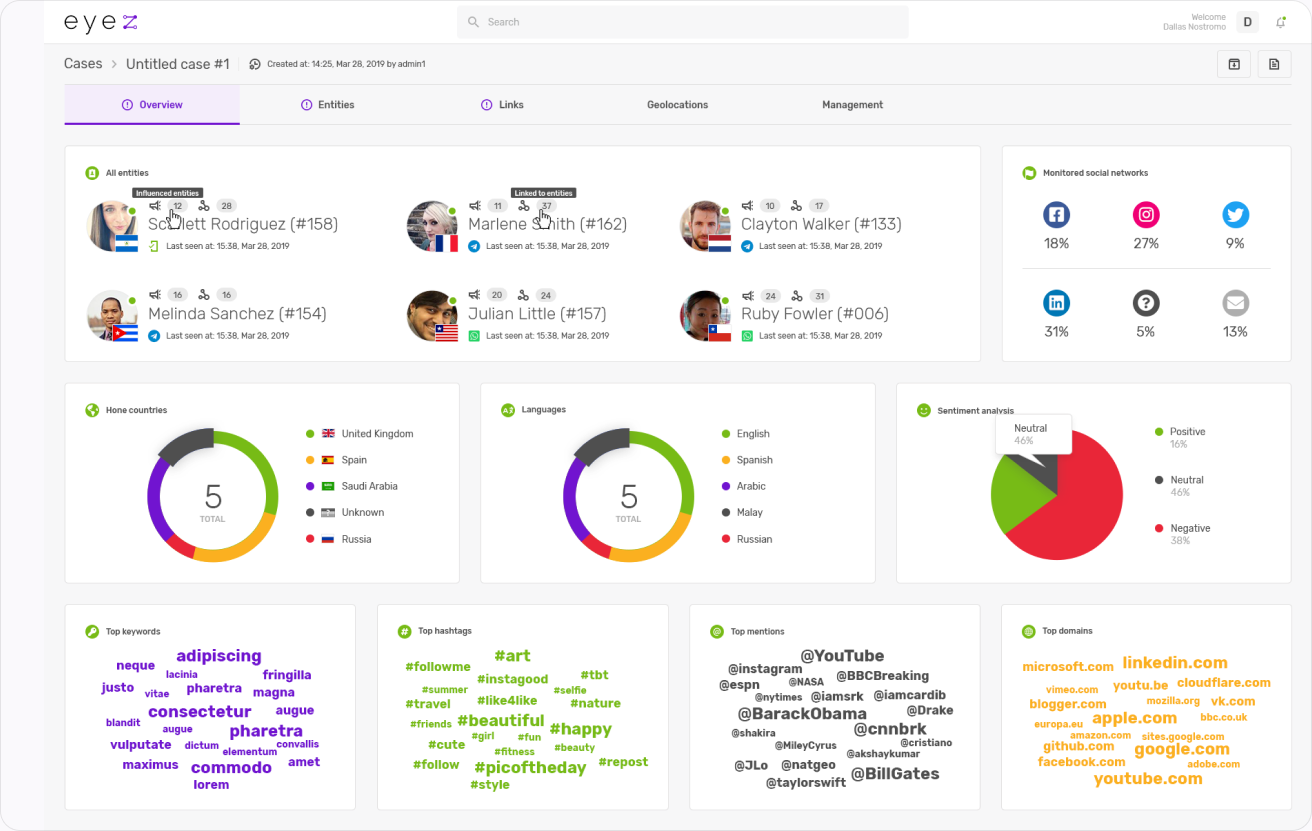
Case overview. The dashboard, scoped to a single case: the entities involved, the networks they use, sentiment, languages and keywords, so the analyst can brief their team from one page.
Profiles
A profile is where matching happens. eyeZ connects accounts across networks into one person, and shows how confident each match is.
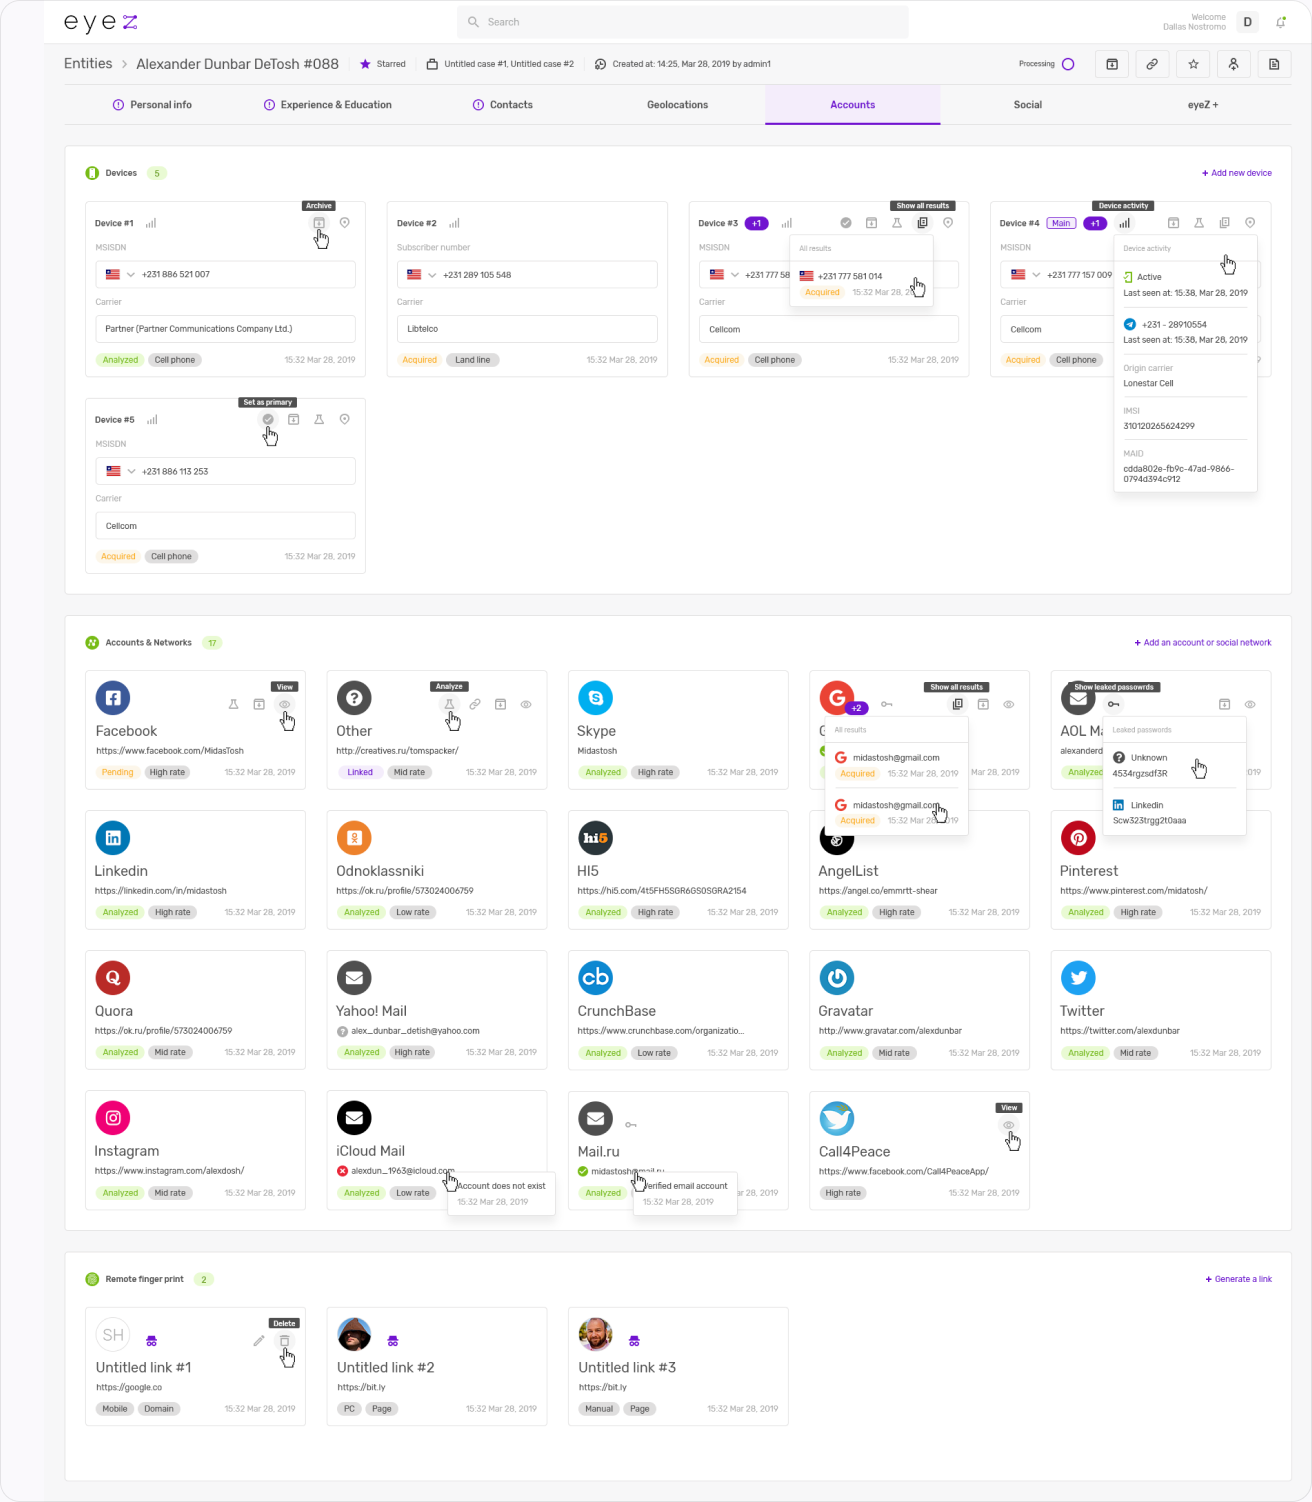
Accounts. All known accounts of a person across social networks, with activity, followers and verification status, so the analyst can confirm or reject each match.
Relations. The people around a profile, grouped by relationship type and strength, with shared contacts highlighted so new leads stand out.